Logan Guild / Case studies
JetBlue, Southwest, and Delta Performance Analysis
16 pages. Read below without downloading. Select a page image to enlarge it.
Page 1 text
Sustained Superior Performance Analysis of jetBlue and Southwest Airlines
Brady Folster, Logan Guild, Conner Holt, Josiah Schemmann, Ziyad Hamed
Page 2 text
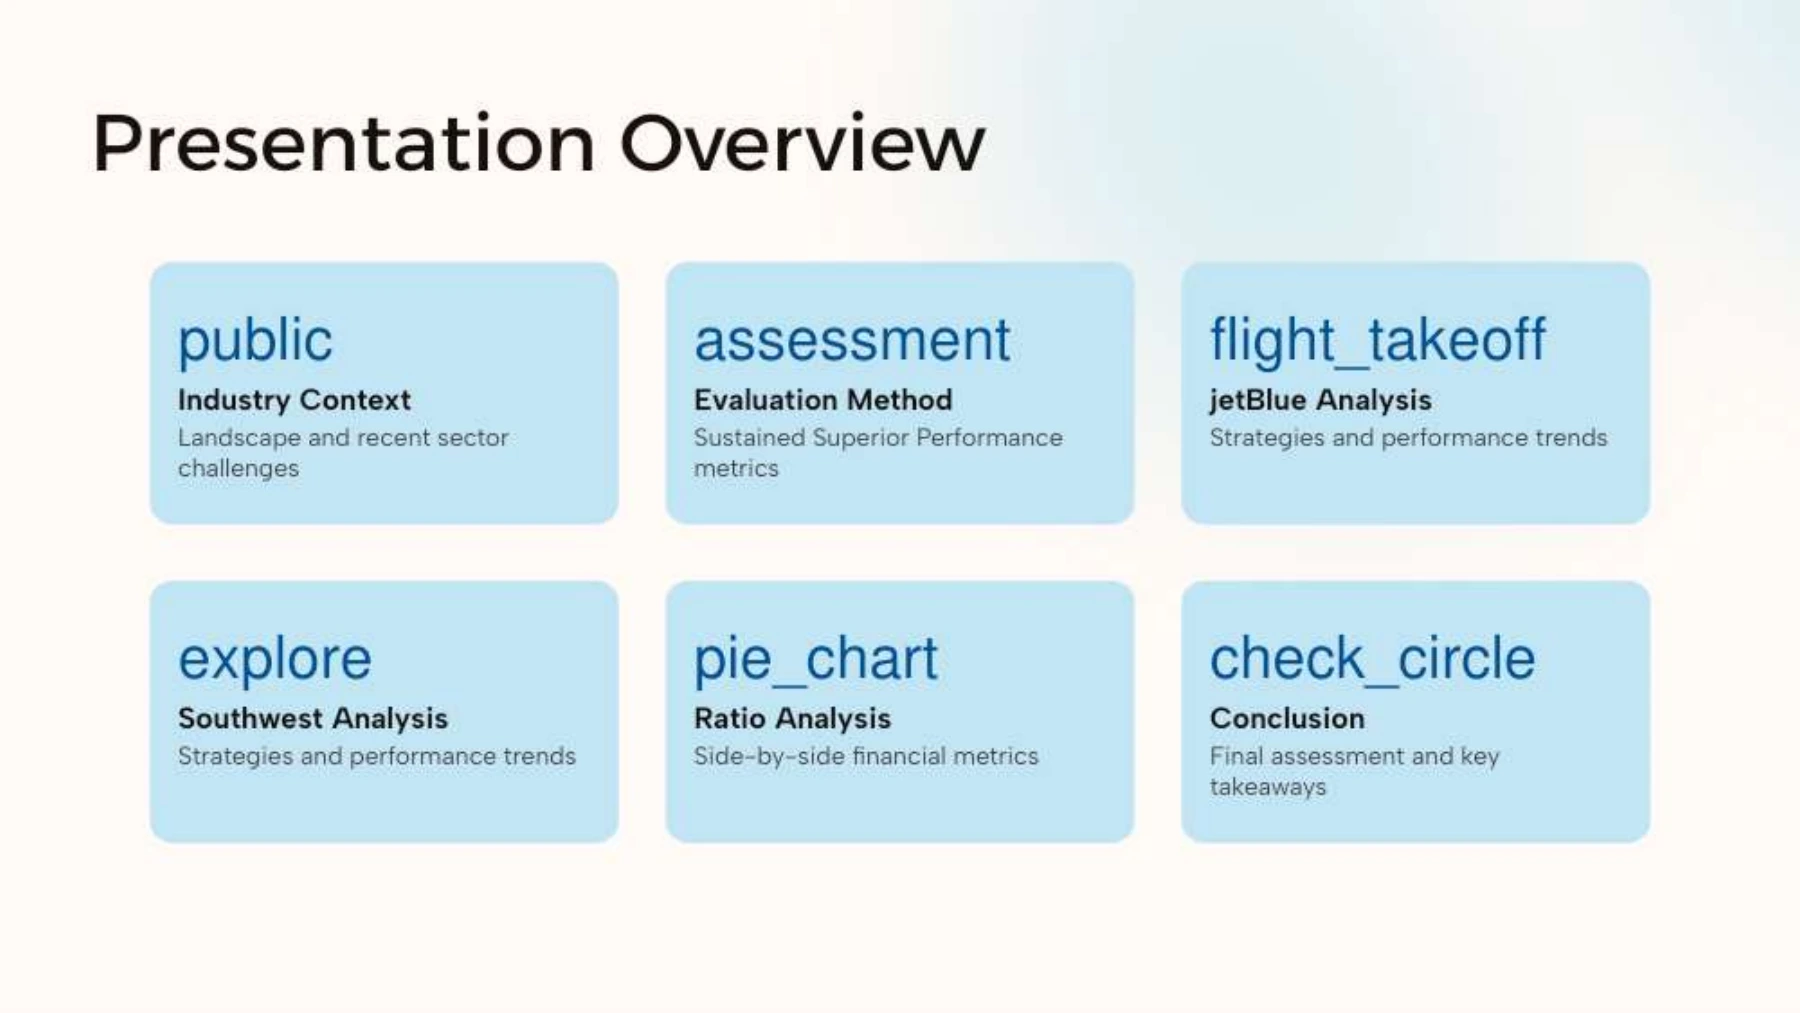
Presentation Overview
public
Industry Context
Landscape and recent sector challenges
assessment
Evaluation Method
Sustained Superior Performance metrics
flight_takeoff
jetBlue Analysis
Strategies and performance trends
explore
Southwest Analysis
Strategies and performance trends
pie_chart
Ratio Analysis
Side-by-side financial metrics
check_circle
Conclusion
Final assessment and key takeaways
Page 3 text
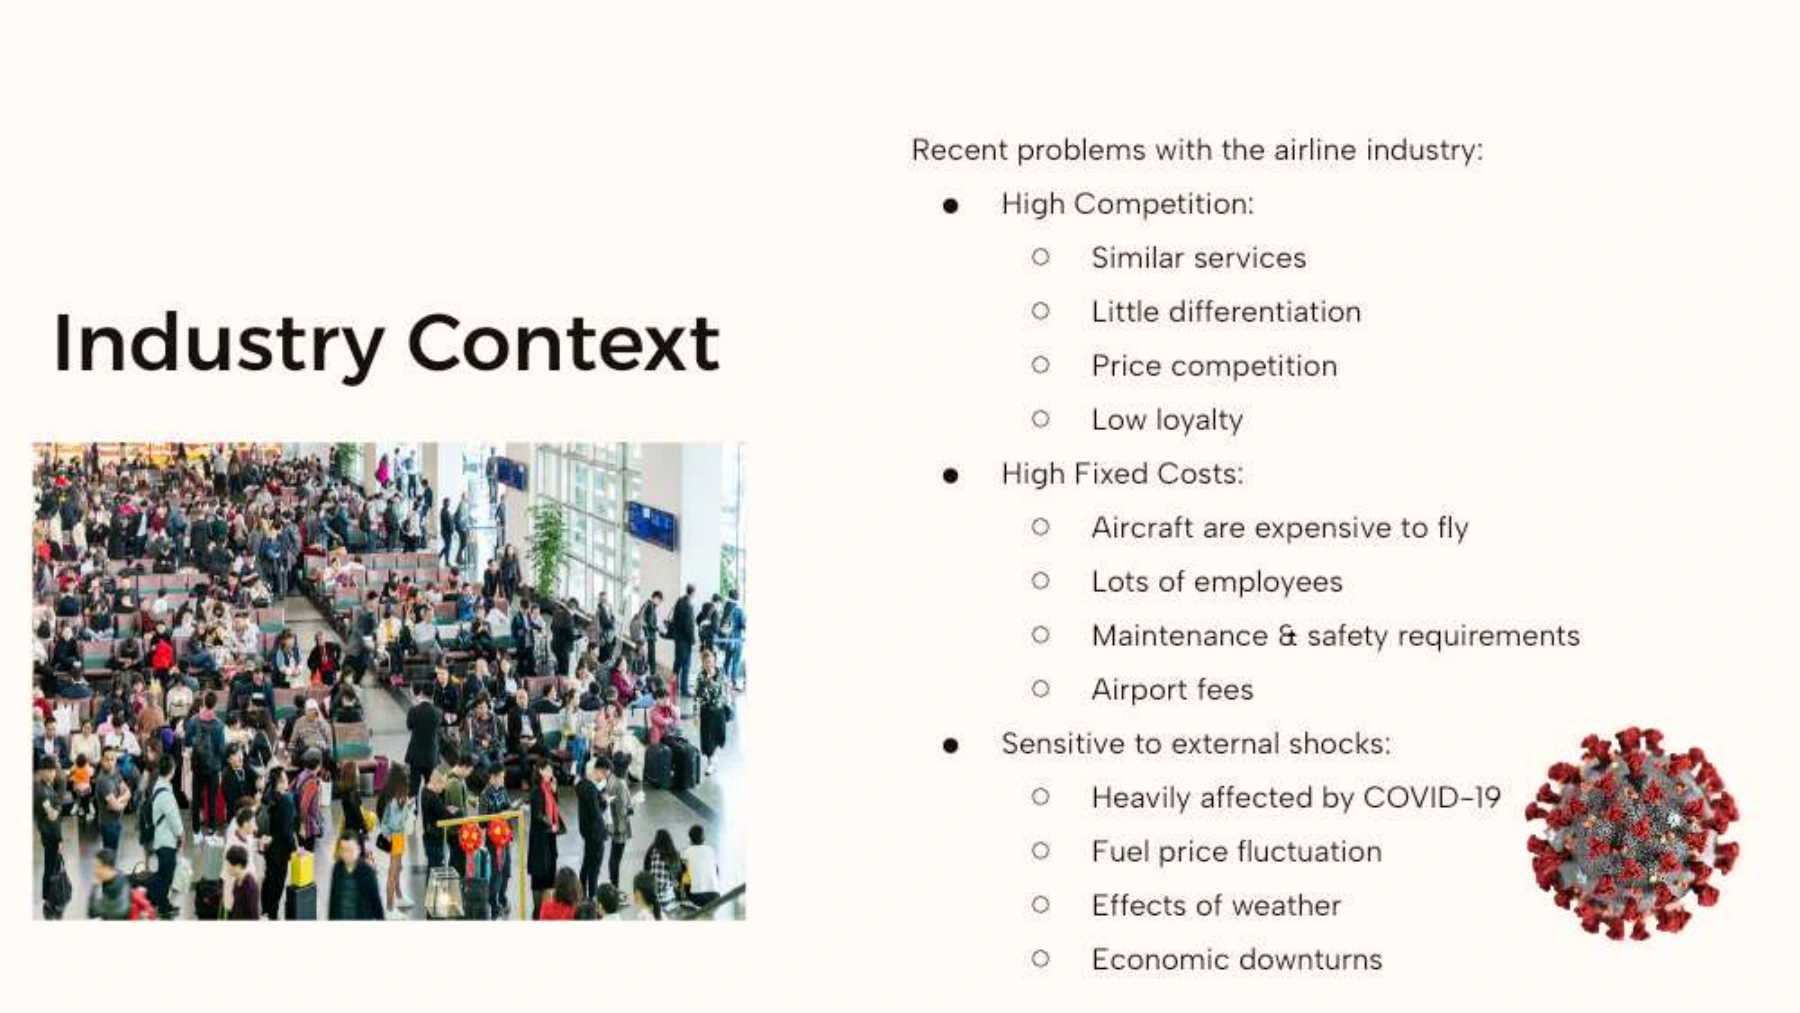
Industry Context
Recent problems with the airline industry:
High Competition:
Similar services
Little differentiation
Price competition
Low loyalty
High Fixed Costs:
Aircraft are expensive to fly
Lots of employees
Maintenance & safety requirements
Airport fees
Sensitive to external shocks:
Heavily affected by COVID-19
Fuel price fluctuation
Effects of weather
Economic downturns
Page 4 text
Sustained Superior Performance?
Sustained superior performance:
Profitability (ROIC) & profit growth greater than that of most if not all others within the same industry.
To determine whether jetBlue/Southwest have achieved sustained superior performance, we can:
Analyze 5-7 year performance with income sheets and balance statements.
Compare companies to the NYSE Arca Airline Index (industry benchmark)
Look at graphs of performance over time
 Key decisions each company has made recently.
Evaluate consistency of outperformance over time.
Page 5 text
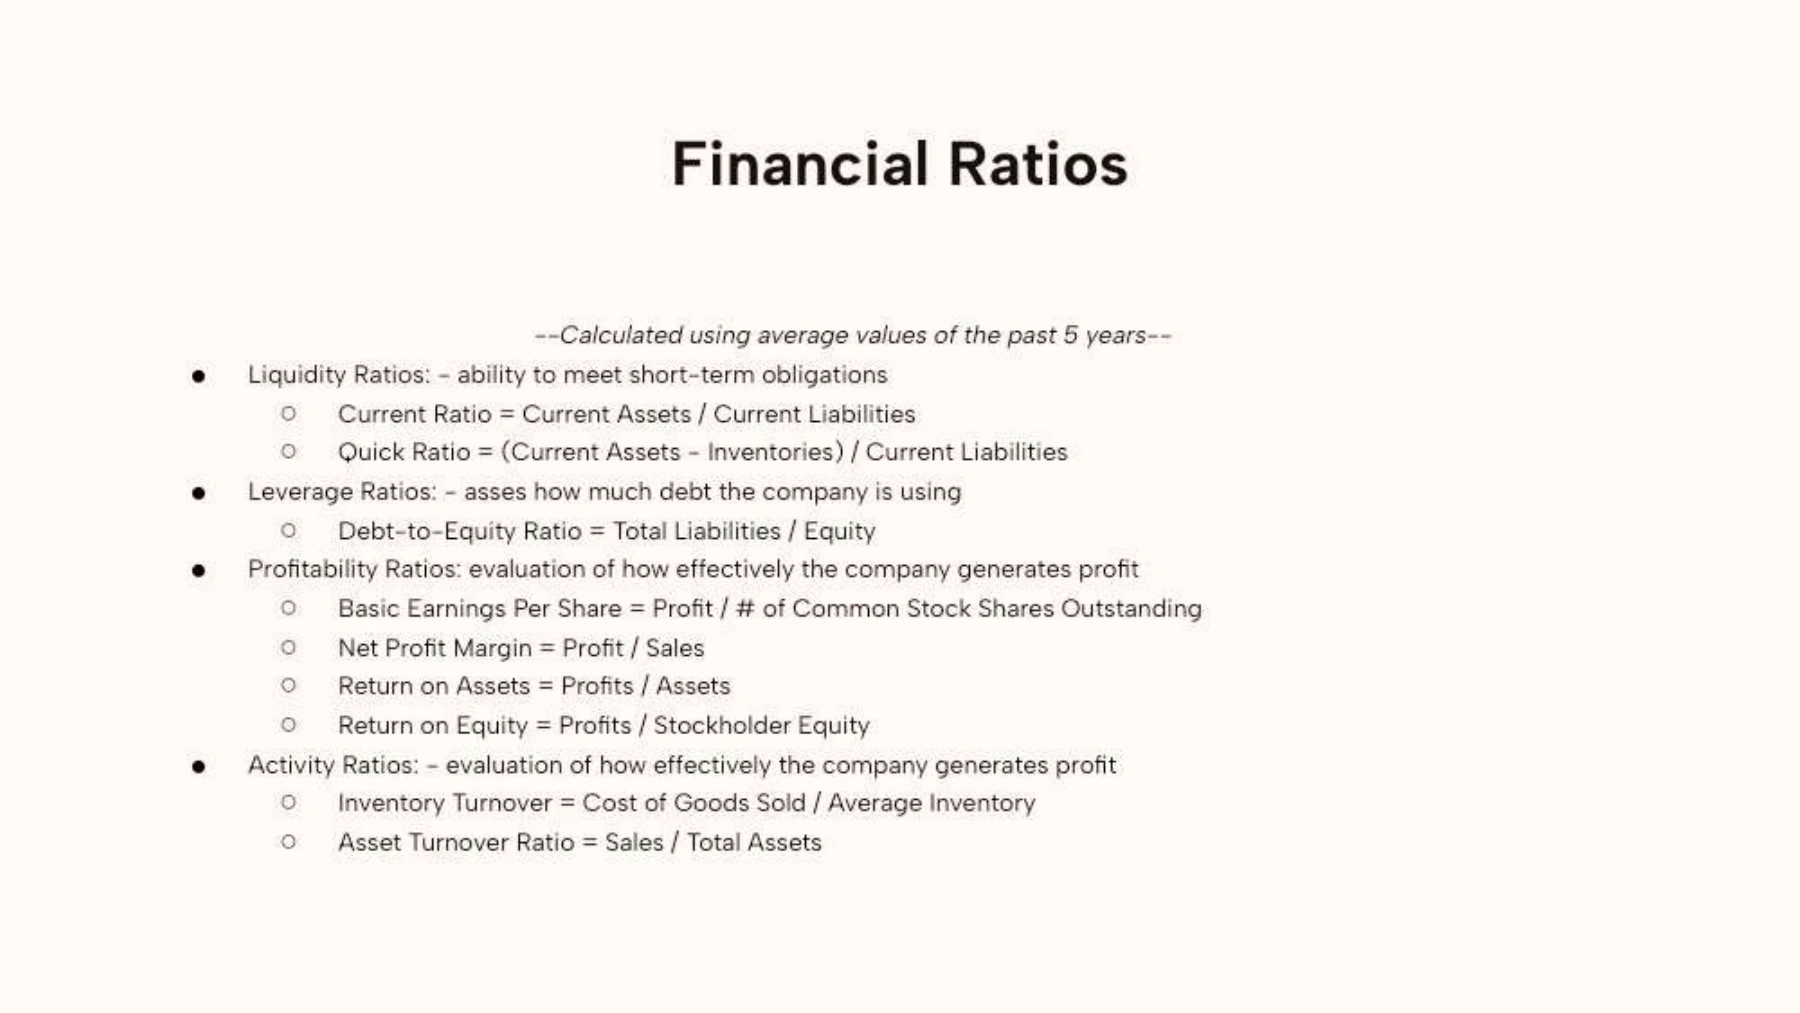
Financial Ratios
--Calculated using average values of the past 5 years--
Liquidity Ratios: - ability to meet short-term obligations
Current Ratio = Current Assets / Current Liabilities
Quick Ratio = (Current Assets - Inventories) / Current Liabilities
Leverage Ratios: - asses how much debt the company is using
Debt-to-Equity Ratio = Total Liabilities / Equity
Profitability Ratios: evaluation of how effectively the company generates profit
Basic Earnings Per Share = Profit / # of Common Stock Shares Outstanding
Net Profit Margin = Profit / Sales
Return on Assets = Profits / Assets
Return on Equity = Profits / Stockholder Equity
Activity Ratios: - evaluation of how effectively the company generates profit
Inventory Turnover = Cost of Goods Sold / Average Inventory
Asset Turnover Ratio = Sales / Total Assets
Page 6 text
jetBlue
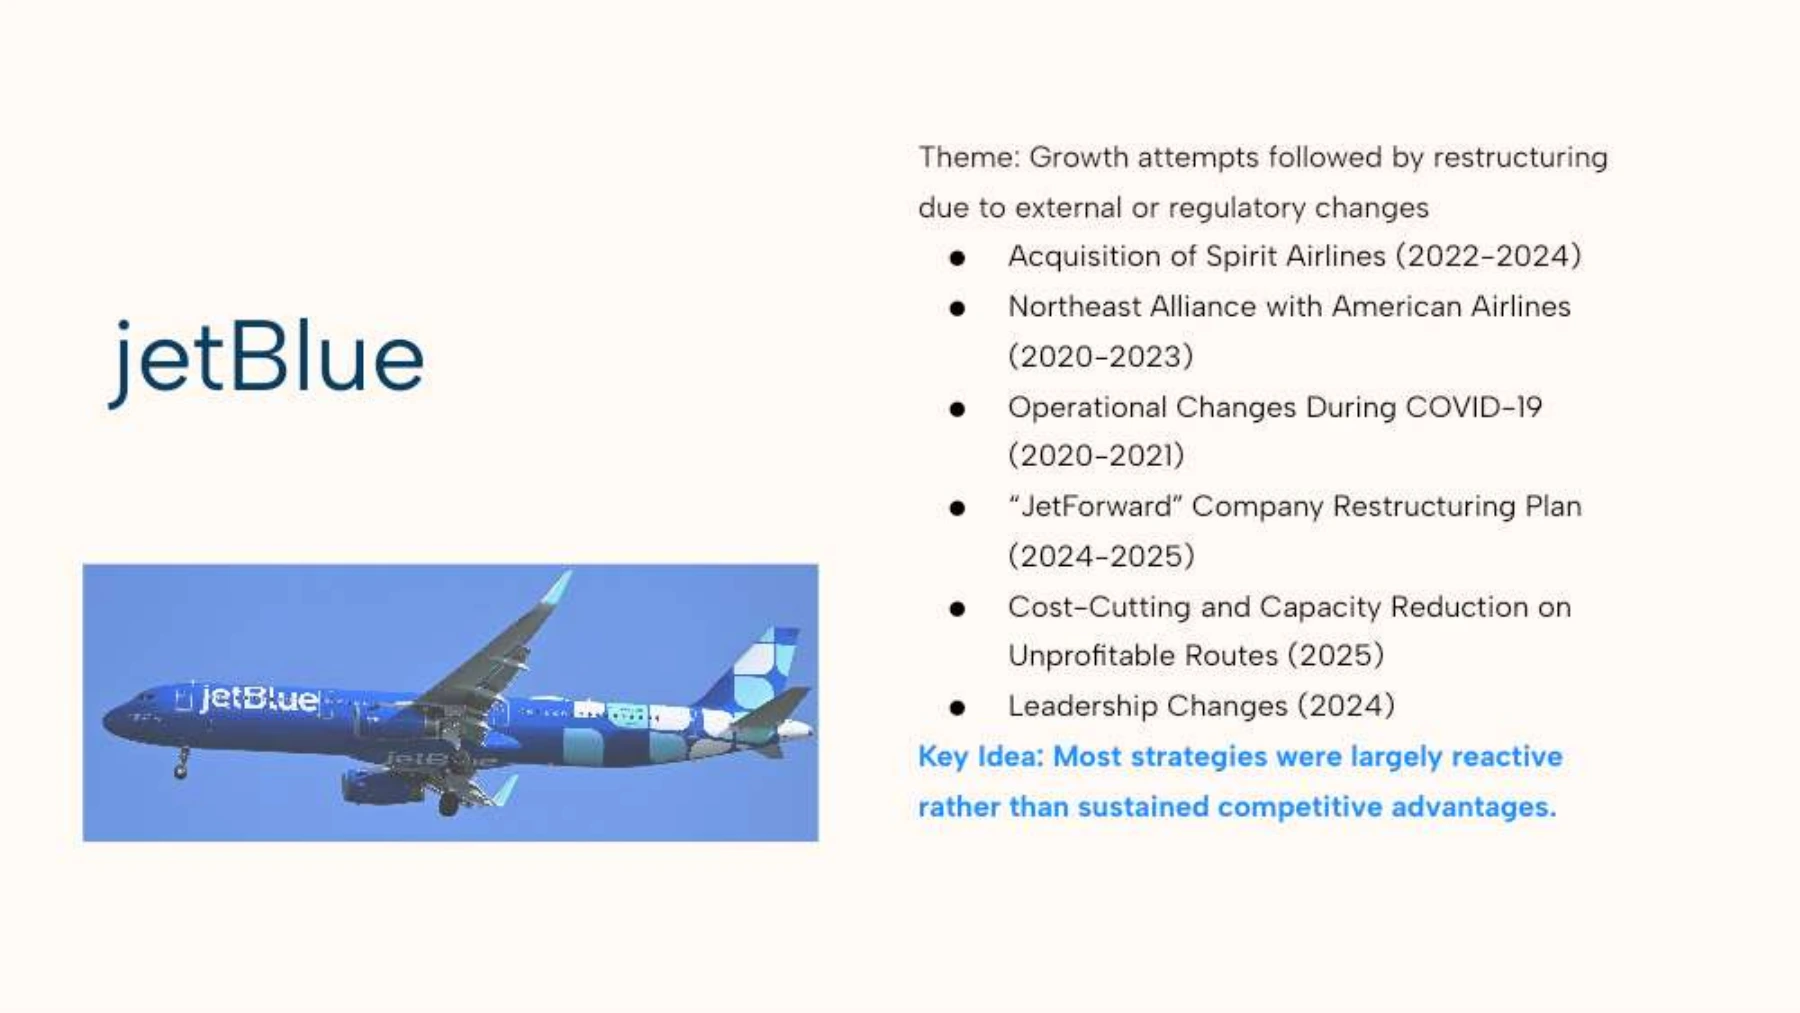
Theme: Growth attempts followed by restructuring due to external or regulatory changes
Acquisition of Spirit Airlines (2022-2024)
Northeast Alliance with American Airlines (2020-2023)
Operational Changes During COVID-19 (2020-2021)
“JetForward” Company Restructuring Plan (2024-2025)
Cost-Cutting and Capacity Reduction on Unprofitable Routes (2025)
Leadership Changes (2024)
Key Idea: Most strategies were largely reactive rather than sustained competitive advantages.
Page 7 text
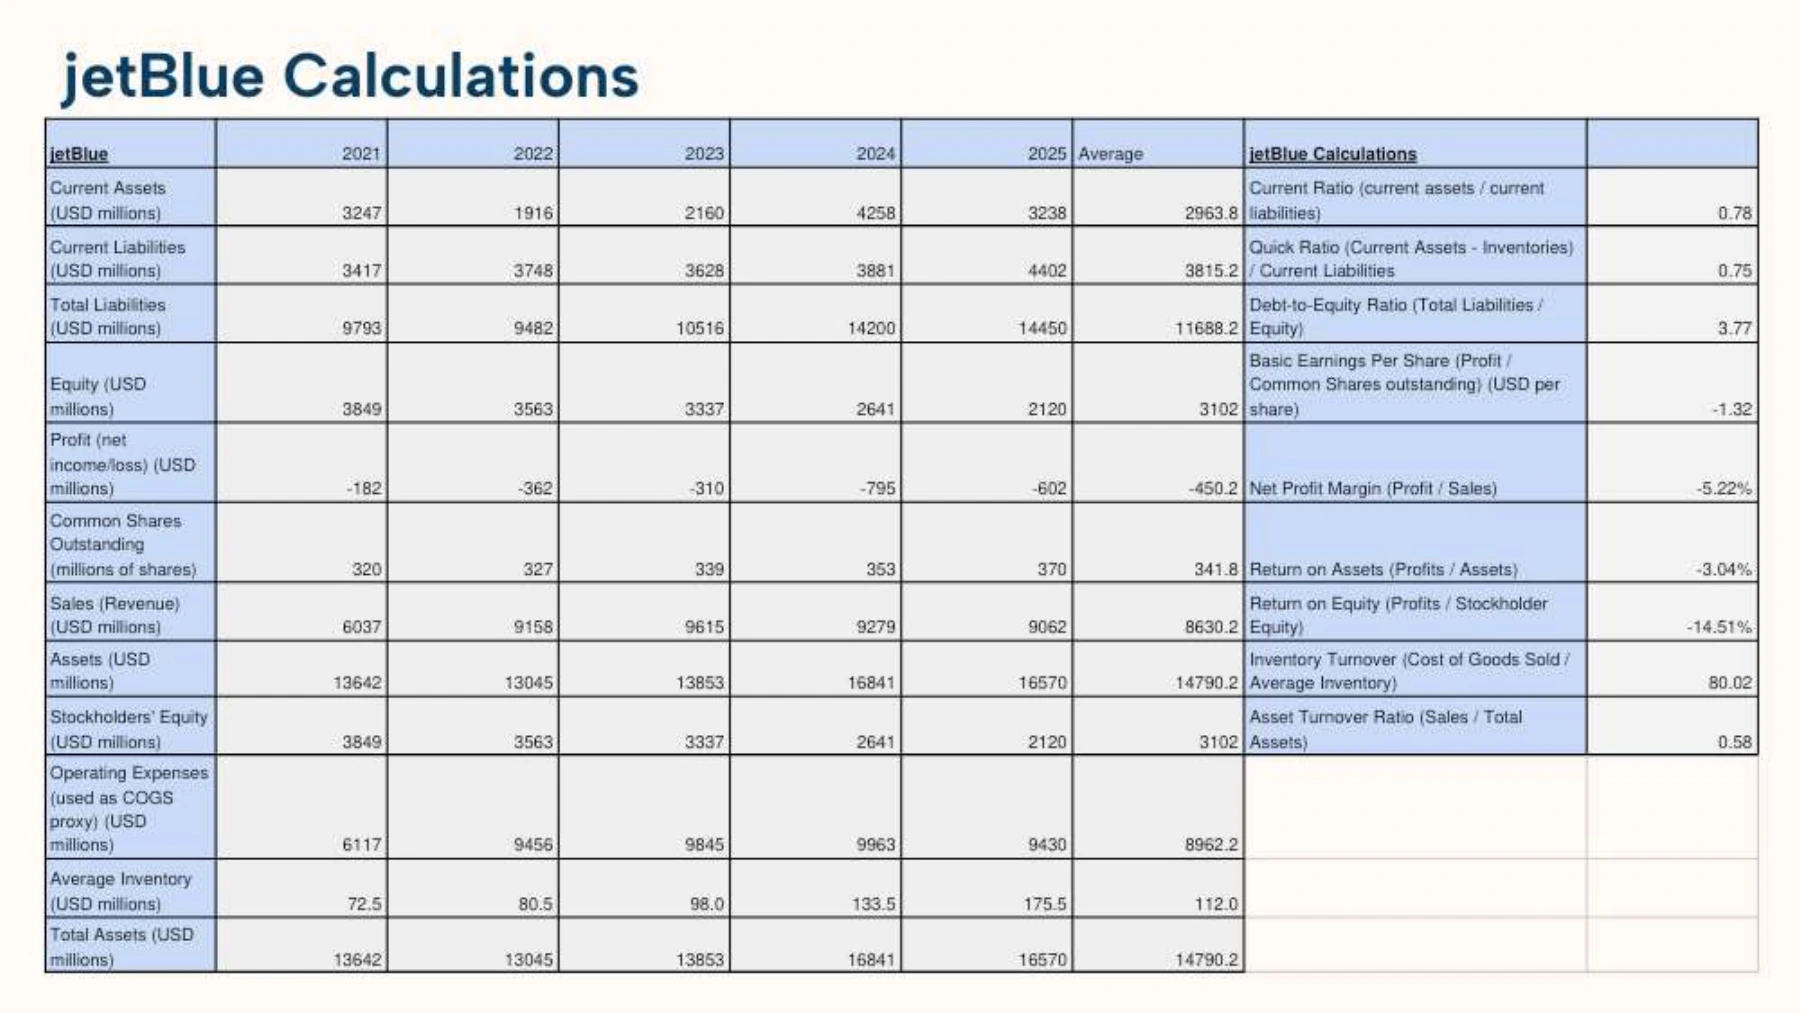
jetBlue Calculations
All the ratios
jetBlue
2021
2022
2023
2024
2025
Average
jetBlue Calculations
Current Assets (USD millions)
3247
1916
2160
4258
3238
2963.8
Current Ratio (current assets / current liabilities)
0.78
Current Liabilities (USD millions)
3417
3748
3628
3881
4402
3815.2
Quick Ratio (Current Assets - Inventories) / Current Liabilities
0.75
Total Liabilities (USD millions)
9793
9482
10516
14200
14450
11688.2
Debt-to-Equity Ratio (Total Liabilities / Equity)
3.77
Equity (USD millions)
3849
3563
3337
2641
2120
3102
Basic Earnings Per Share (Profit / Common Shares outstanding) (USD per share)
-1.32
Profit (net income/loss) (USD millions)
-182
-362
-310
-795
-602
-450.2
Net Profit Margin (Profit / Sales)
-5.22%
Common Shares Outstanding (millions of shares)
320
327
339
353
370
341.8
Return on Assets (Profits / Assets)
-3.04%
Sales (Revenue) (USD millions)
6037
9158
9615
9279
9062
8630.2
Return on Equity (Profits / Stockholder Equity)
-14.51%
Assets (USD millions)
13642
13045
13853
16841
16570
14790.2
Inventory Turnover (Cost of Goods Sold / Average Inventory)
80.02
Stockholders' Equity (USD millions)
3849
3563
3337
2641
2120
3102
Asset Turnover Ratio (Sales / Total Assets)
0.58
Operating Expenses (used as COGS proxy) (USD millions)
6117
9456
9845
9963
9430
8962.2
Average Inventory (USD millions)
72.5
80.5
98.0
133.5
175.5
112.0
Total Assets (USD millions)
13642
13045
13853
16841
16570
14790.2
Page 8 text
jetBlue Analysis
Key Observations about jetBlue during research:
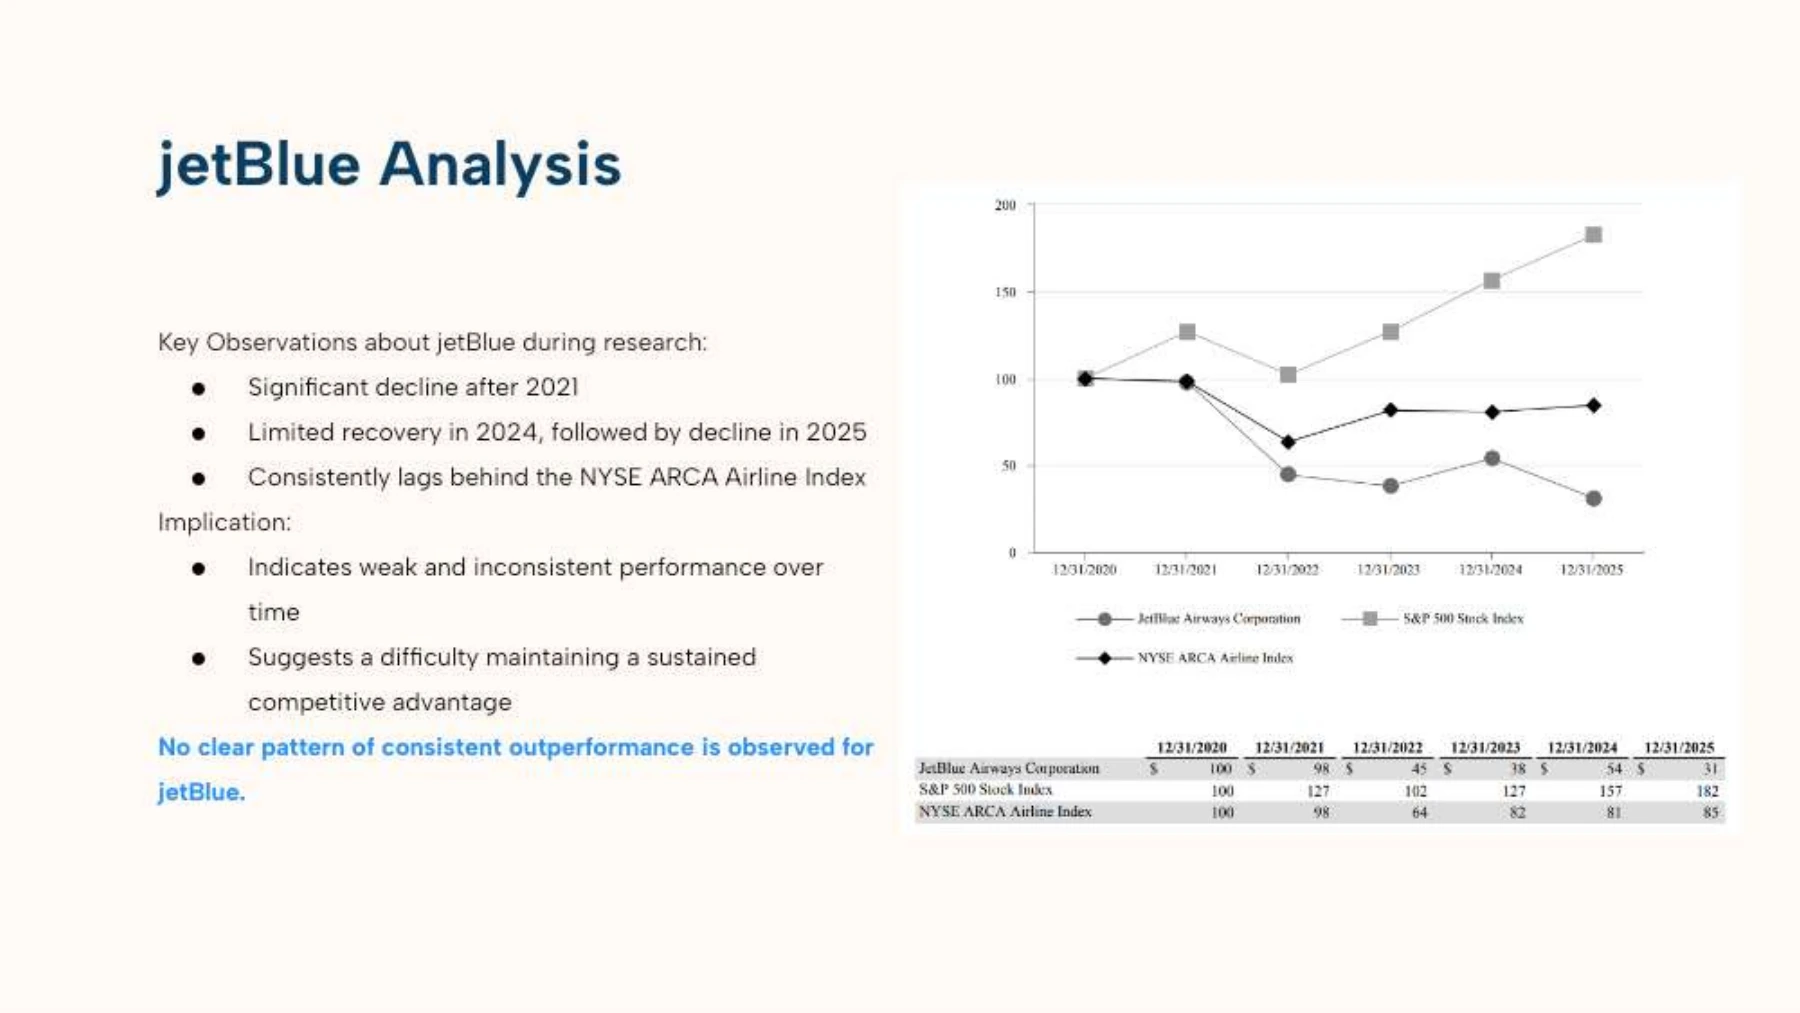
Significant decline after 2021
Limited recovery in 2024, followed by decline in 2025
Consistently lags behind the NYSE ARCA Airline Index
Implication:
Indicates weak and inconsistent performance over time
Suggests a difficulty maintaining a sustained competitive advantage
No clear pattern of consistent outperformance is observed for jetBlue.
Page 9 text
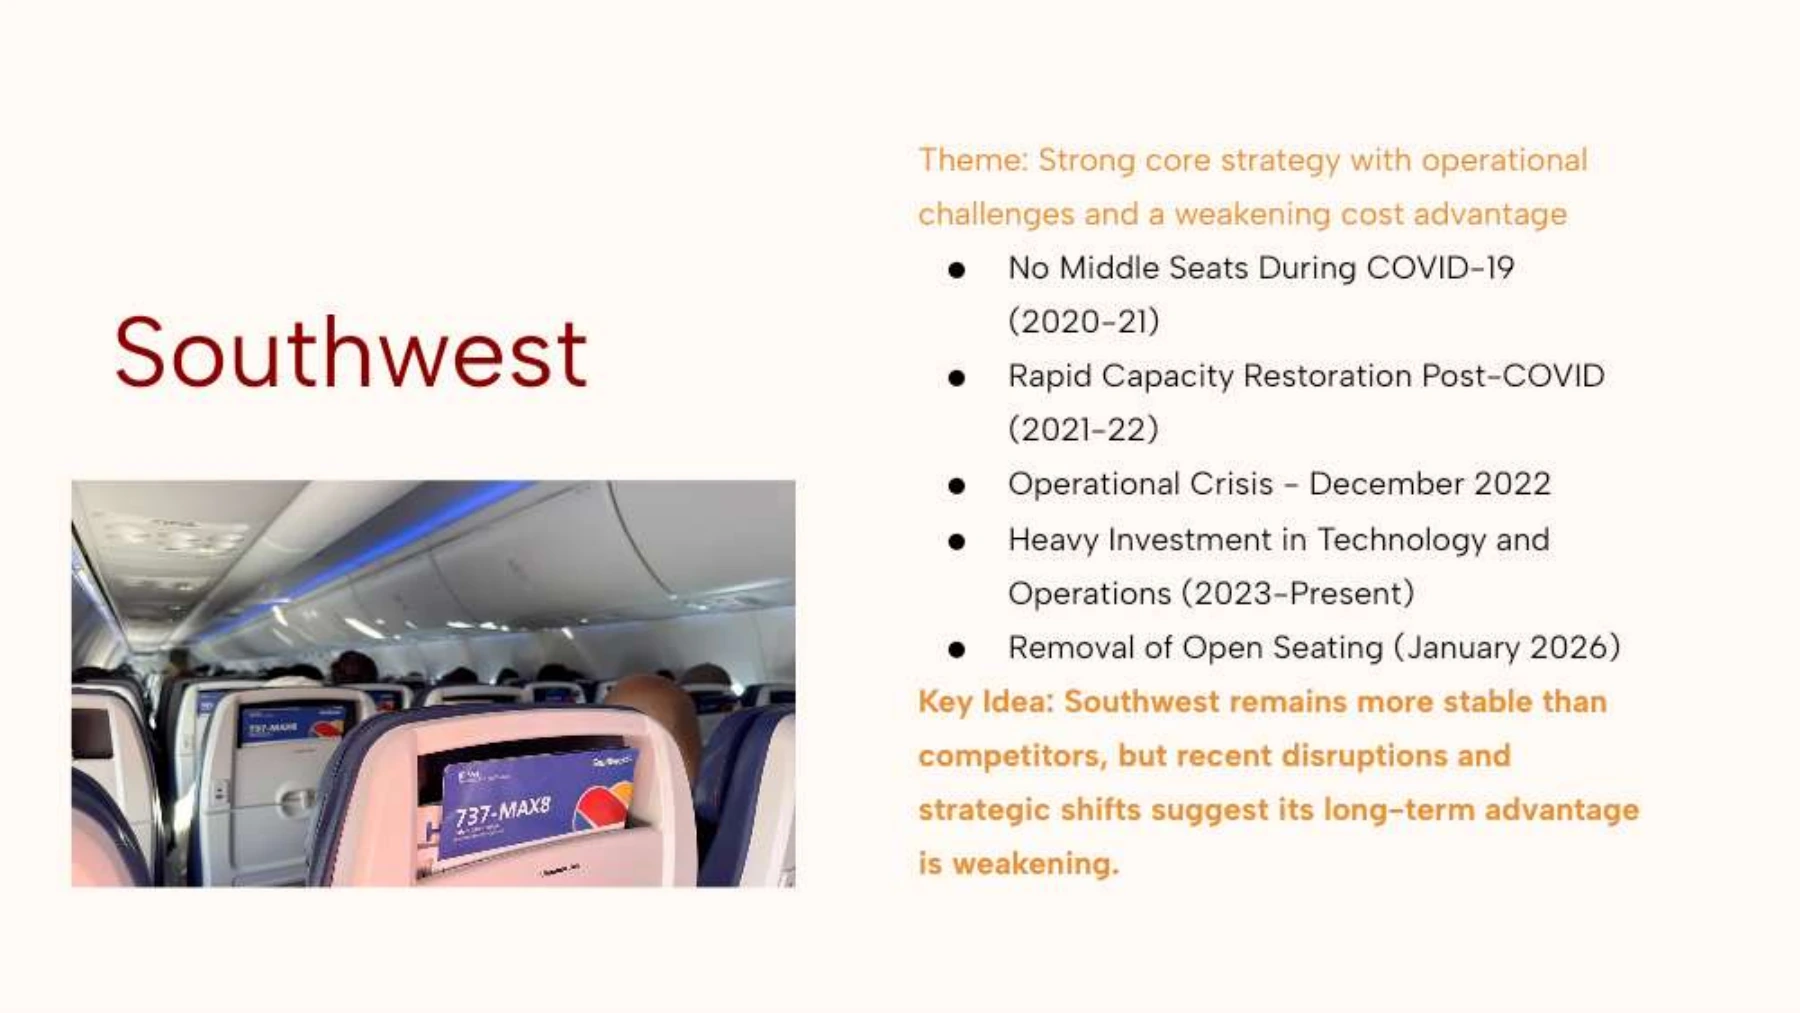
Southwest
Theme: Strong core strategy with operational challenges and a weakening cost advantage
No Middle Seats During COVID-19 (2020-21)
Rapid Capacity Restoration Post-COVID (2021-22)
Operational Crisis - December 2022
Heavy Investment in Technology and Operations (2023-Present)
Removal of Open Seating (January 2026)
Key Idea: Southwest remains more stable than competitors, but recent disruptions and strategic shifts suggest its long-term advantage is weakening.
Page 10 text
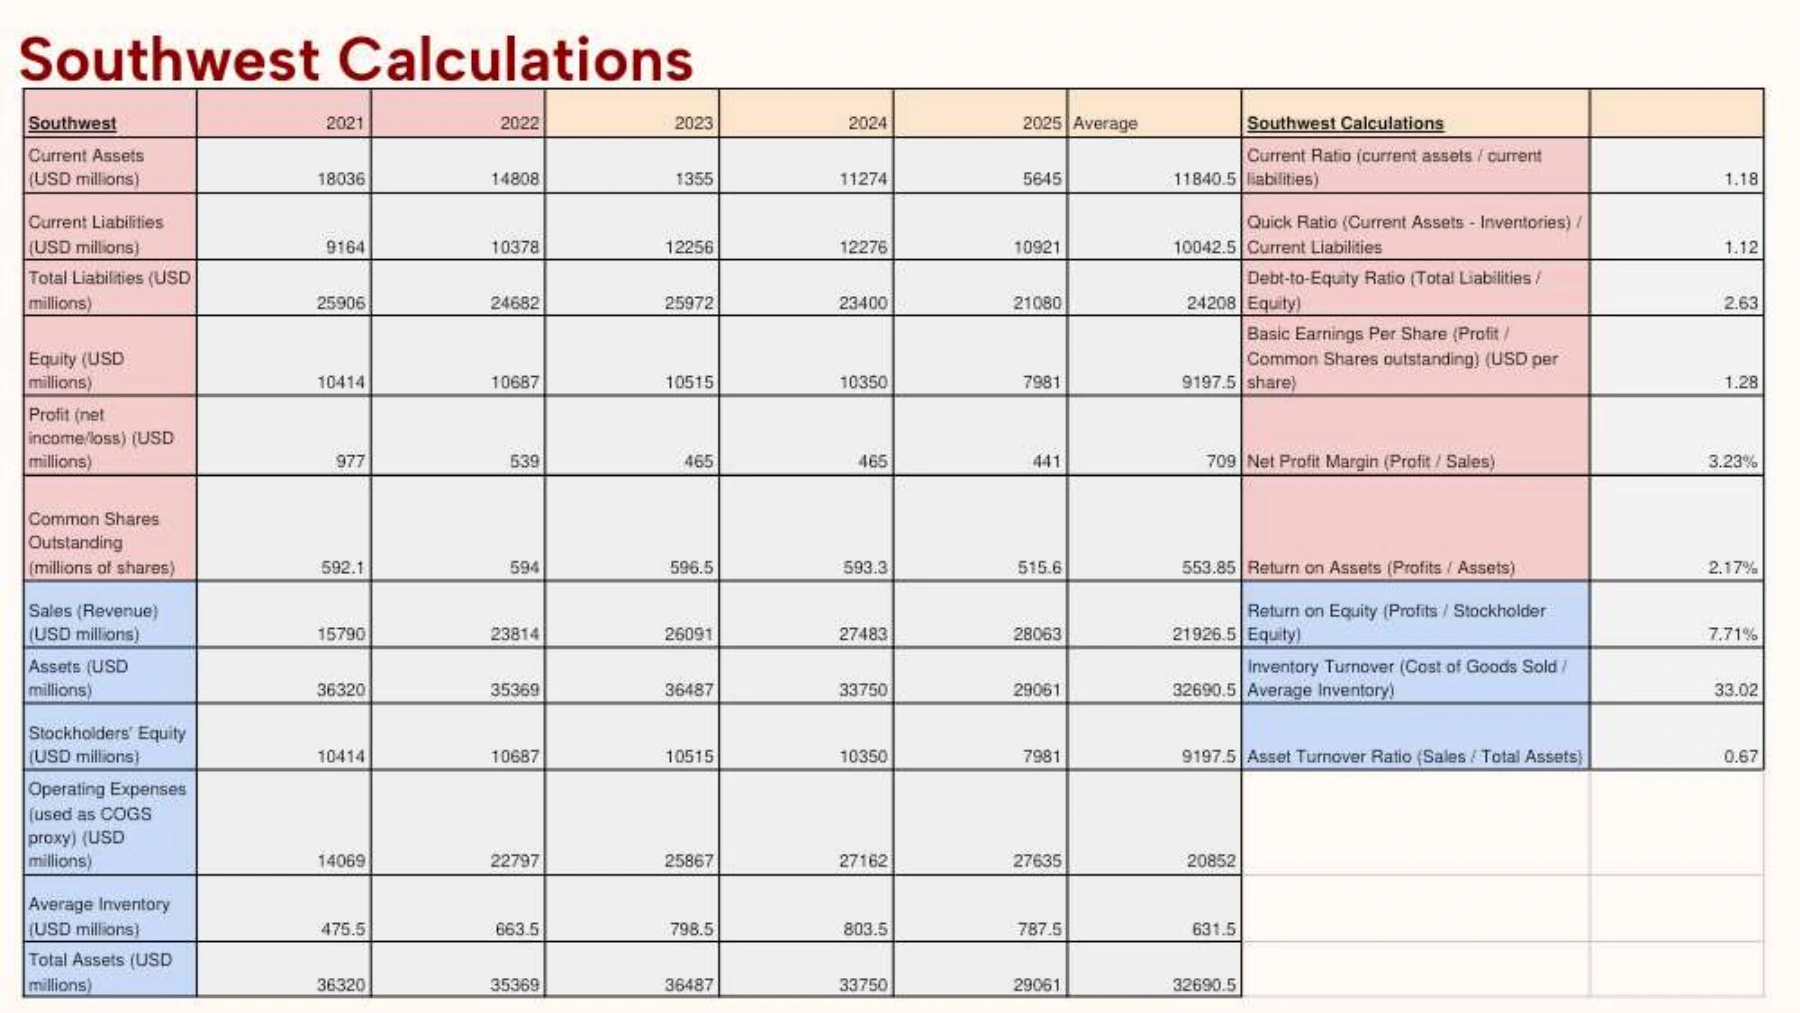
Southwest Calculations
Southwest
2021
2022
2023
2024
2025
Average
Southwest Calculations
Current Assets (USD millions)
18036
14808
1355
11274
5645
11840.5
Current Ratio (current assets / current liabilities)
1.18
Current Liabilities (USD millions)
9164
10378
12256
12276
10921
10042.5
Quick Ratio (Current Assets - Inventories) / Current Liabilities
1.12
Total Liabilities (USD millions)
25906
24682
25972
23400
21080
24208
Debt-to-Equity Ratio (Total Liabilities / Equity)
2.63
Equity (USD millions)
10414
10687
10515
10350
7981
9197.5
Basic Earnings Per Share (Profit / Common Shares outstanding) (USD per share)
1.28
Profit (net income/loss) (USD millions)
977
539
465
465
441
709
Net Profit Margin (Profit / Sales)
3.23%
Common Shares Outstanding (millions of shares)
592.1
594
596.5
593.3
515.6
553.85
Return on Assets (Profits / Assets)
2.17%
Sales (Revenue) (USD millions)
15790
23814
26091
27483
28063
21926.5
Return on Equity (Profits / Stockholder Equity)
7.71%
Assets (USD millions)
36320
35369
36487
33750
29061
32690.5
Inventory Turnover (Cost of Goods Sold / Average Inventory)
33.02
Stockholders' Equity (USD millions)
10414
10687
10515
10350
7981
9197.5
Asset Turnover Ratio (Sales / Total Assets)
0.67
Operating Expenses (used as COGS proxy) (USD millions)
14069
22797
25867
27162
27635
20852
Average Inventory (USD millions)
475.5
663.5
798.5
803.5
787.5
631.5
Total Assets (USD millions)
36320
35369
36487
33750
29061
32690.5
Page 11 text
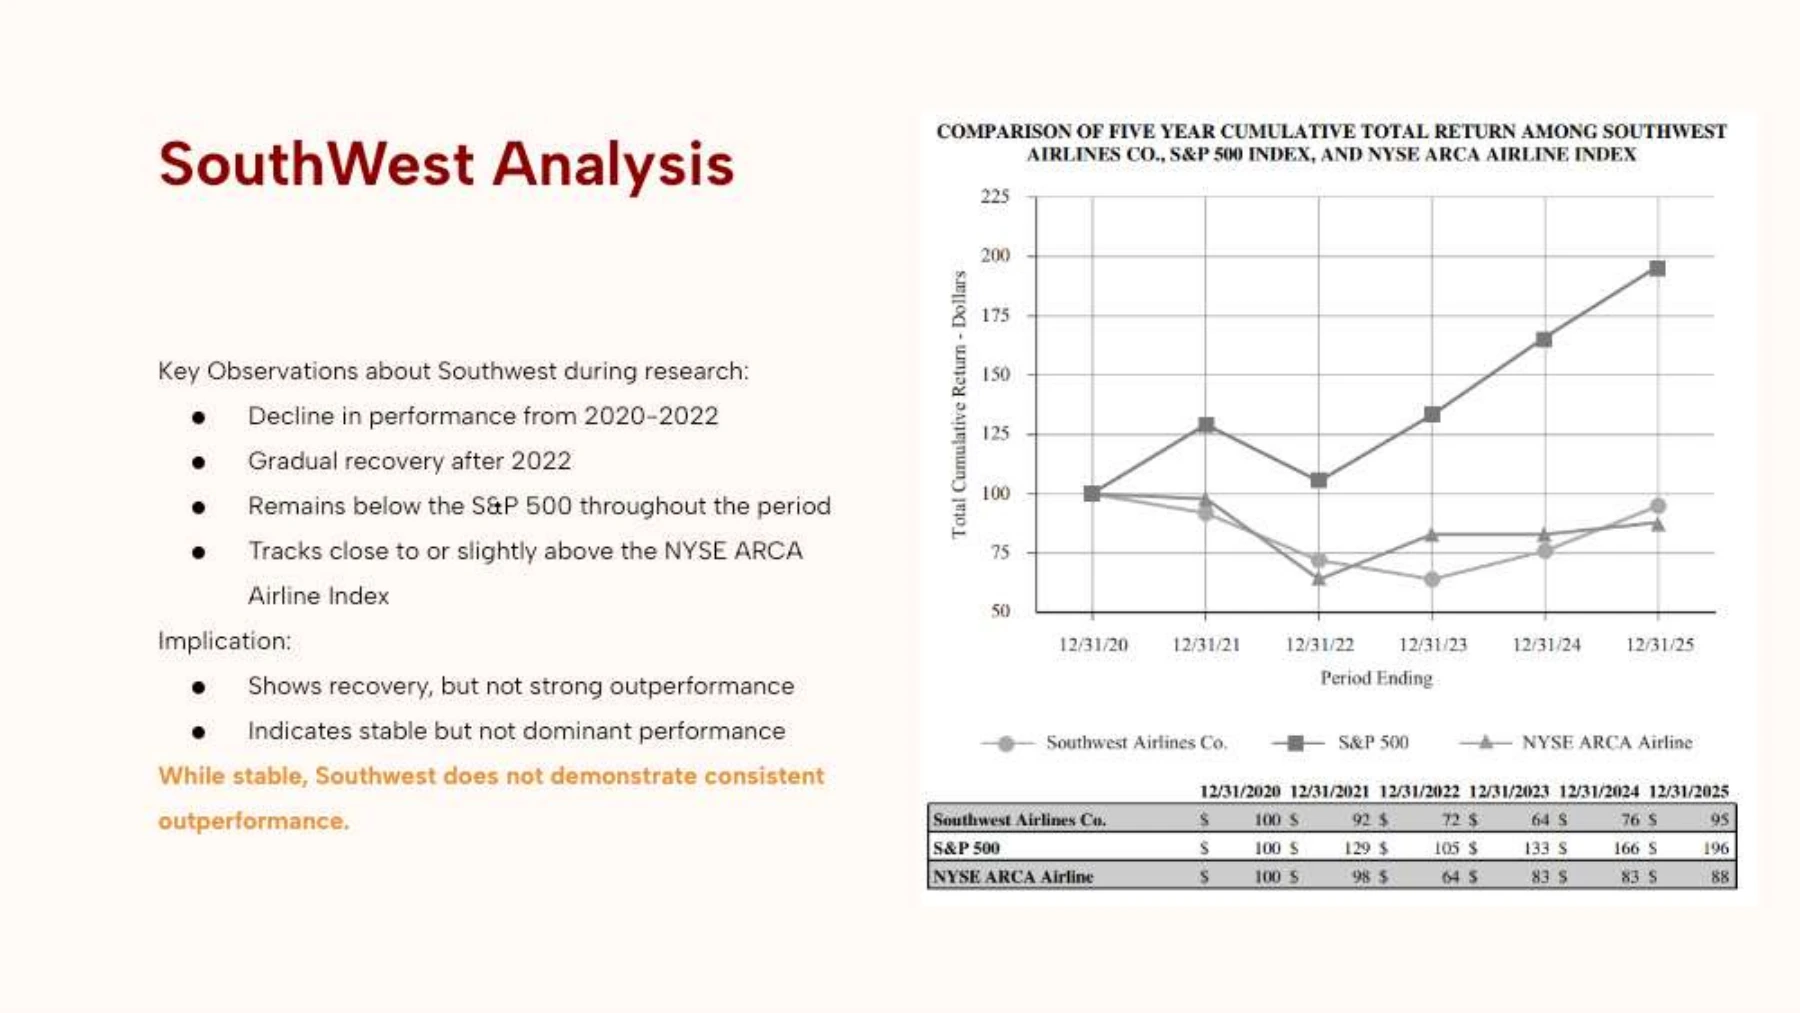
SouthWest Analysis
Key Observations about Southwest during research:
Decline in performance from 2020-2022
Gradual recovery after 2022
Remains below the S&P 500 throughout the period
Tracks close to or slightly above the NYSE ARCA Airline Index
Implication:
Shows recovery, but not strong outperformance
Indicates stable but not dominant performance
While stable, Southwest does not demonstrate consistent outperformance.
Page 12 text
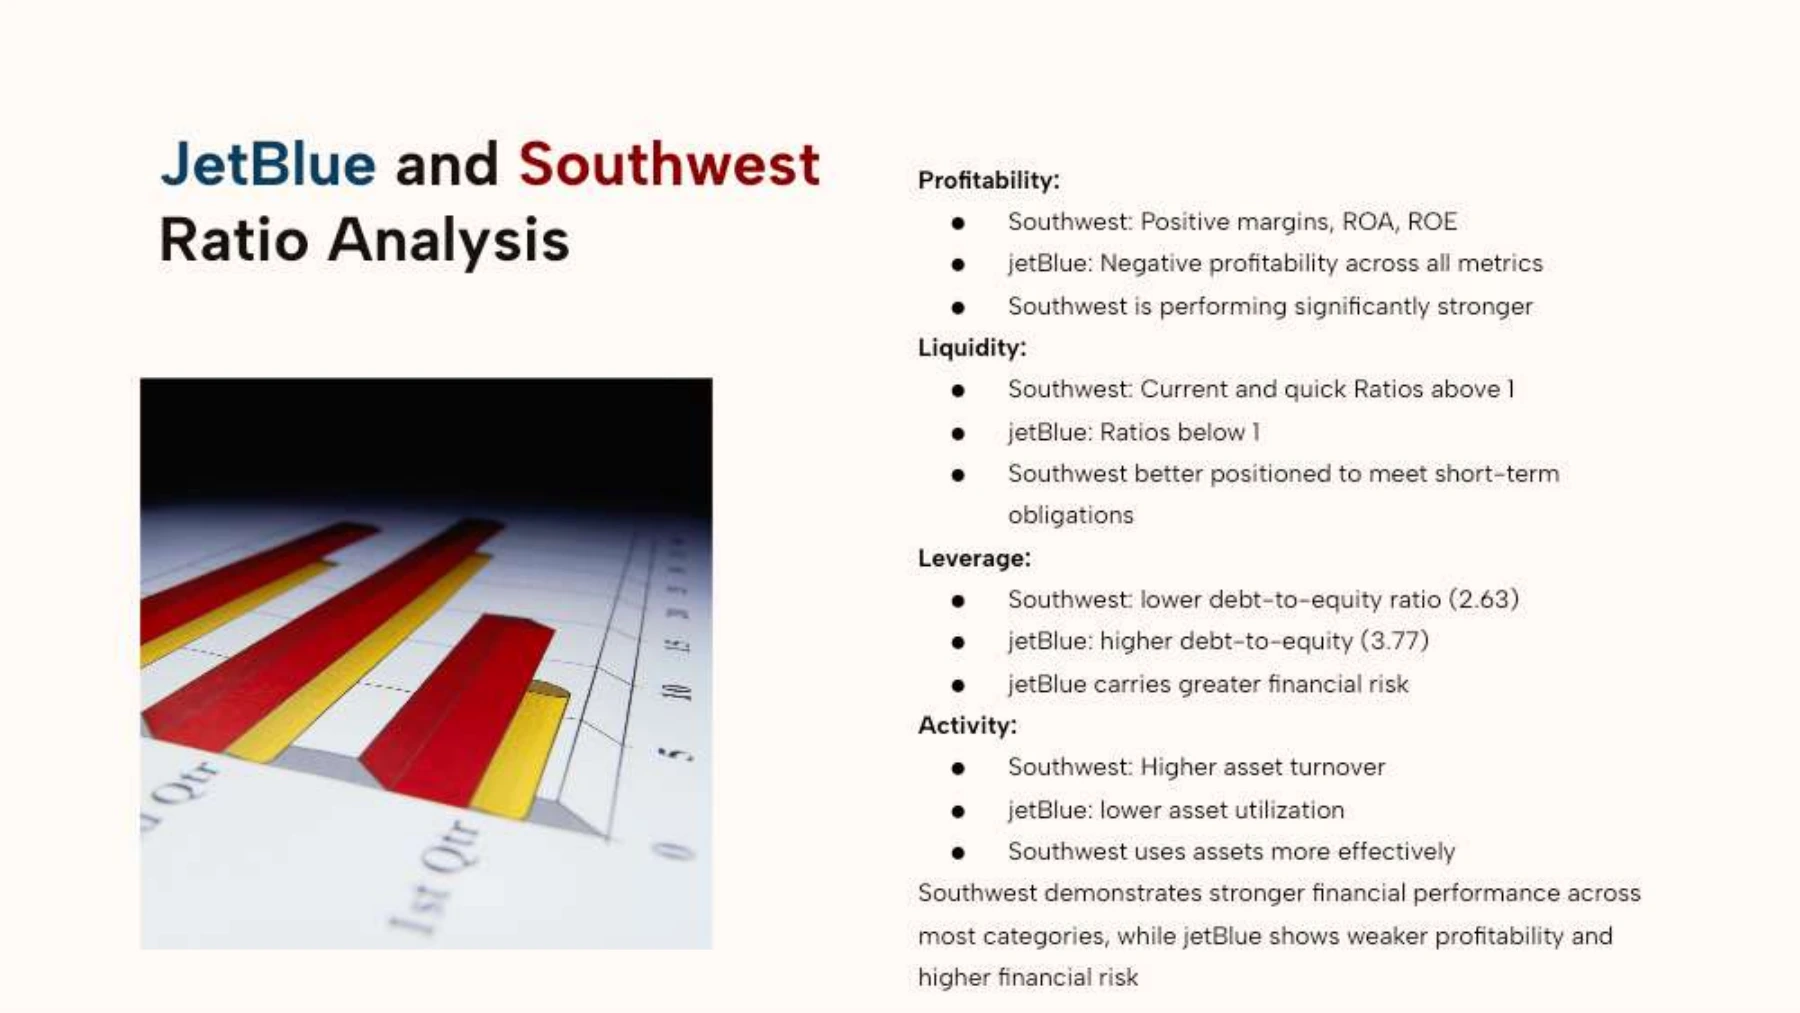
JetBlue and Southwest Ratio Analysis
Profitability:
Southwest: Positive margins, ROA, ROE
jetBlue: Negative profitability across all metrics
Southwest is performing significantly stronger
Liquidity:
Southwest: Current and quick Ratios above 1
jetBlue: Ratios below 1
Southwest better positioned to meet short-term obligations
Leverage:
Southwest: lower debt-to-equity ratio (2.63)
jetBlue: higher debt-to-equity (3.77)
jetBlue carries greater financial risk
Activity:
Southwest: Higher asset turnover
jetBlue: lower asset utilization
Southwest uses assets more effectively
Southwest demonstrates stronger financial performance across most categories, while jetBlue shows weaker profitability and higher financial risk
Page 13 text
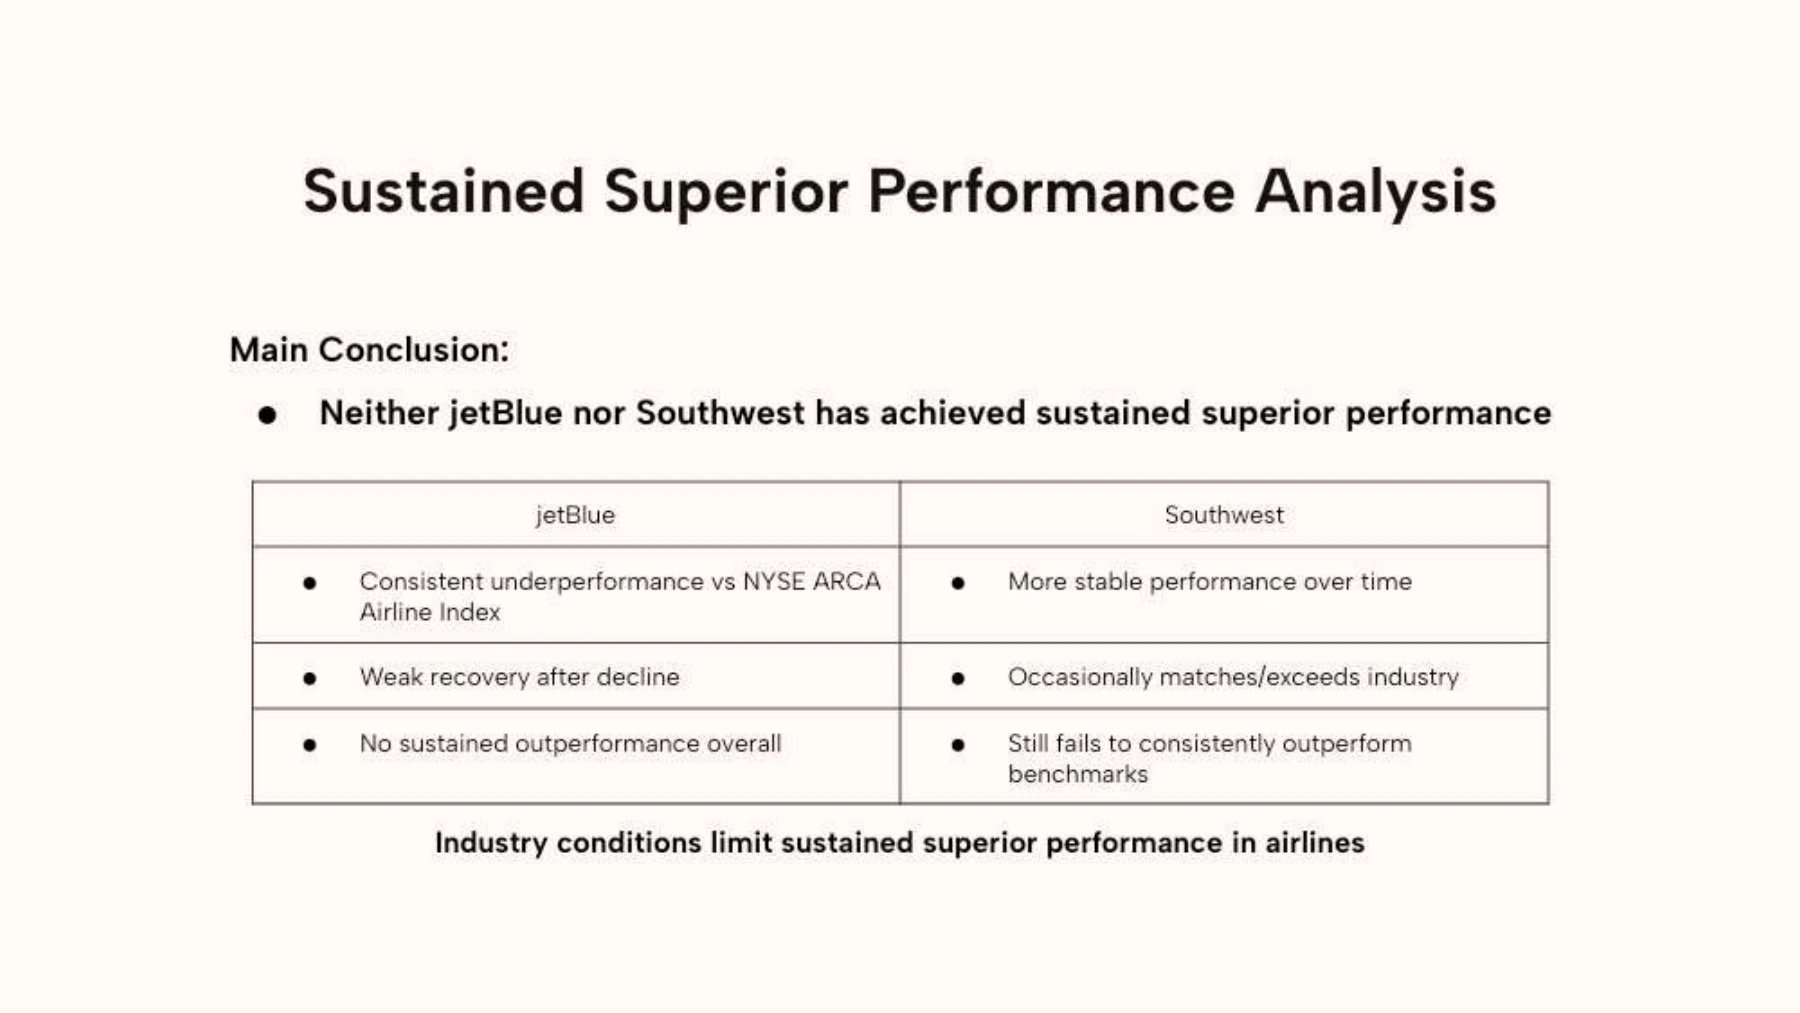
Sustained Superior Performance Analysis
Main Conclusion:
Neither jetBlue nor Southwest has achieved sustained superior performance
jetBlue
Southwest
Consistent underperformance vs NYSE ARCA Airline Index
More stable performance over time
Weak recovery after decline
Occasionally matches/exceeds industry
No sustained outperformance overall
Still fails to consistently outperform benchmarks
Industry conditions limit sustained superior performance in airlines
Page 14 text
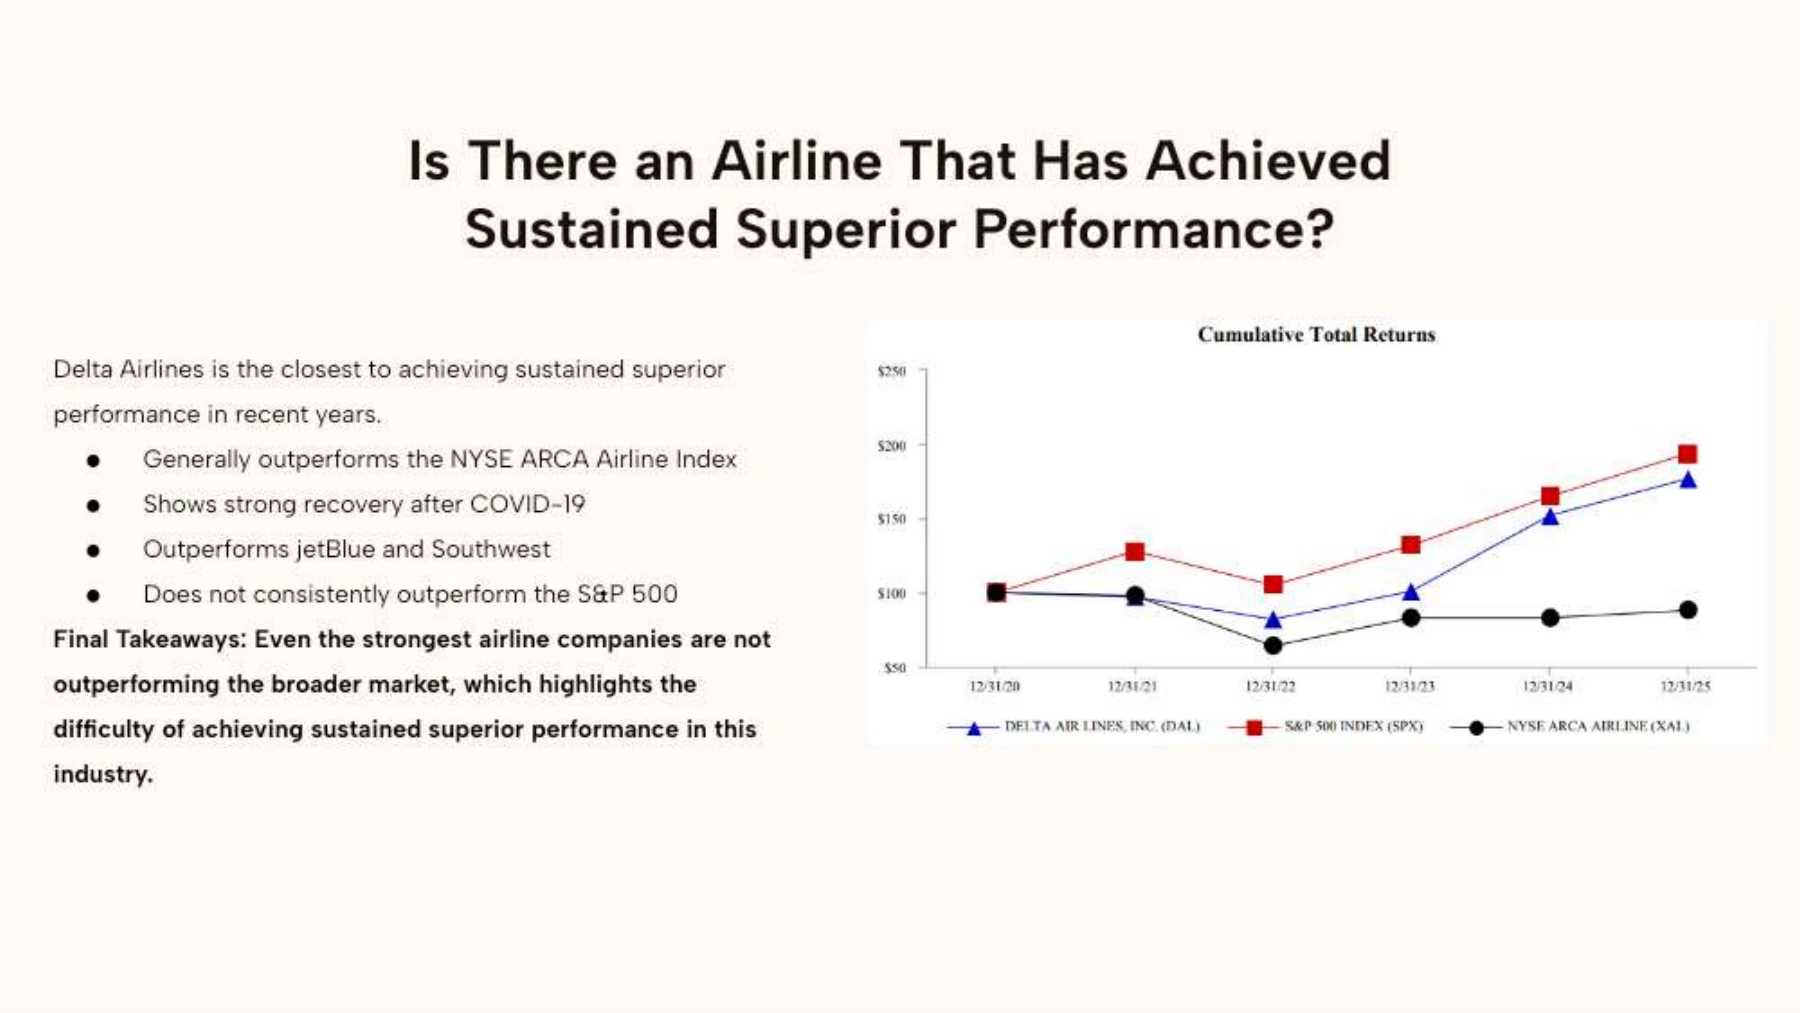
Is There an Airline That Has Achieved Sustained Superior Performance?
Delta Airlines is the closest to achieving sustained superior performance in recent years.
Generally outperforms the NYSE ARCA Airline Index
Shows strong recovery after COVID-19
Outperforms jetBlue and Southwest
Does not consistently outperform the S&P 500
Final Takeaways: Even the strongest airline companies are not outperforming the broader market, which highlights the difficulty of achieving sustained superior performance in this industry.

Page 15 text
Thank you
Questions?
Page 16 text
Delta Air Lines. “Delta Air Lines, Inc. - Financials.” Ir.delta.com, ir.delta.com/financials/default.aspx. JetBlue. “JetBlue Airways Corporation - Financials - Annual Reports.” Ir.jetblue.com, 2024, ir.jetblue.com/financials/annual-reports/default.aspx. “Southwest Airlines Co.” Southwest Airlines Co., 2025, www.southwestairlinesinvestorrelations.com/company-information/annual-reports-proxy-statements. FOX. “JetBlue to Reduce Flights as Part of Cost-Cutting Measures, Internal Restructuring.” FOX 35 Orlando, 18 June 2025. www.fox35orlando.com/news/jetblue-reduce-flights-part-cost-cutting-measures-internal-restructuring. Accessed 16 Apr. 2026. Habib, Abid. “JetBlue Reveals “Jet Forward” Strategy to Turn Its Performance Around.” Simple Flying, 5 Sept. 2024, simpleflying.com/jetblue-reveals-jet-forward-strategy-to-turn-its-performance-around/. Witman, Paul, et al. “The Southwest Airlines Winter Meltdown - Case Studies on Risk, Technical Debt, Operations, Passengers, Regulators, Revenue, and Brand.” Information Systems Education Journal, vol. 22, no. 5, 1 Jan. 2024, pp. 59–71, https://doi.org/10.62273/efwa2093. Fox, Linda. “Southwest Airlines’ CIO on Plans for Its $1.7B Technology Investment.” Www.phocuswire.com, 8 Apr. 2024, www.phocuswire.com/southwest-airlines-cio-tech-investment. Resources